
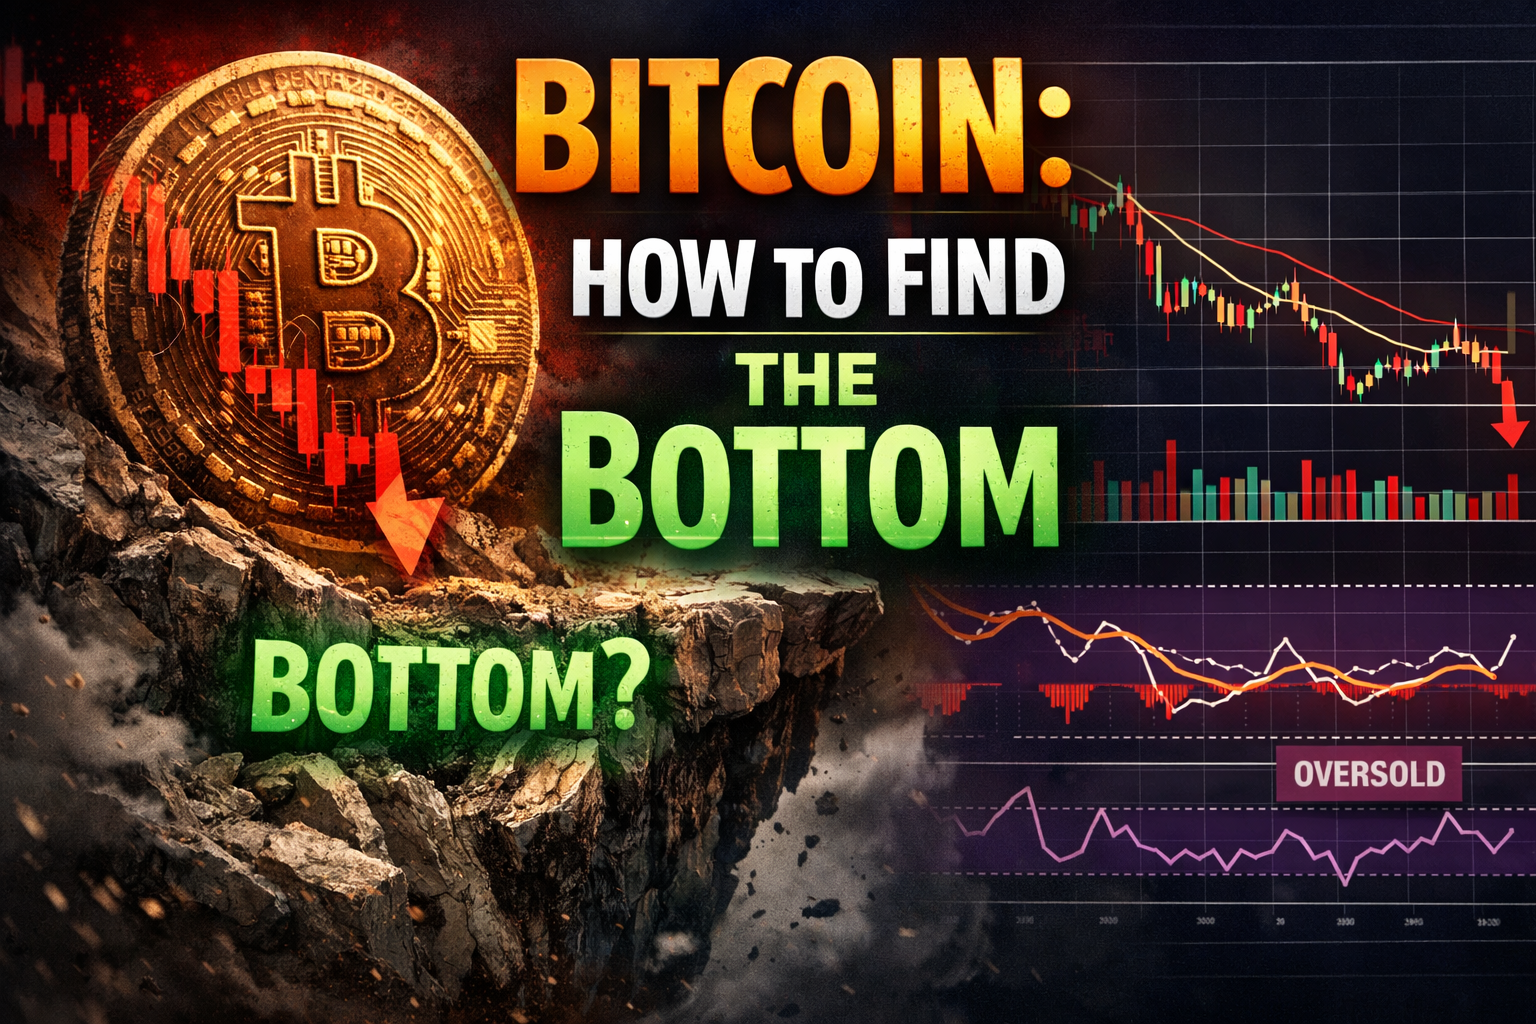
Bitcoin: How to find the Bottom
Bitcoin is in a deep correction phase after reaching record highs above ~$125,000 in late 2025. Prices have fallen sharply — dipping below ~$63,000–$65,000 before partial rebounds. The broader crypto market has shed roughly $2 trillion in value, wiping out many post-election gains. Sentiment is weak and institutional flows have turned negative, with U.S. Bitcoin ETFs seeing major outflows. This backdrop forms the starting point for spotting potential cycle lows. (The Guardian)
Market analysts, including the creator of the stock-to-flow model PlanB, have suggested multiple bear-market scenarios that imply deeper drawdowns may still come, depending on macro factors and crypto adoption trends. (CryptoRank)
🧠 What Does a “Bottom” Really Mean?
A market bottom doesn’t always mean the absolute lowest possible price. Often it means a structural shift where:
- Selling pressure exhausts;
- Risk-taking starts to return;
- Key technical and on-chain metrics turn supportive;
- Sentiment shifts from fear to cautious optimism.
In highly volatile assets like Bitcoin, bottoms are formed, retested, and then confirmed, rather than simply hitting a single low number.
📊 Key Indicators to Help Identify Bitcoin’s Bottom
Here are the most commonly used tools and what they mean:
🔹 1. Relative Strength Index (RSI)
The RSI is an oscillator that moves between 0–100 and indicates oversold or overbought conditions. Traditionally:
- Below 30 = oversold, potential bottom region.
- Rising divergence — price falling while RSI climbs — can signal weakening downtrend momentum. (Binance)
🔹 2. MACD (Momentum Trend Indicator)
Bullish crossovers (MACD line crossing above signal line) near lows may indicate downward momentum is ending. This is lagging but useful when confirmed by other signals. (Binance)
🔹 3. Volume and Liquidity Profiles
Capitulation bottoms often occur where selling volume spikes significantly and liquidity dries up — meaning fewer sellers and the market starts to absorb selling pressure. (Barchart.com)
🔹 4. Moving Averages at Extreme Levels
When Bitcoin trades far below long-term averages (like the 200-day MA), it can enter oversold territory that historically aligns with longer-term cycle lows. (Investing.com India)
🔹 5. On-Chain Metrics (e.g., MVRV)
Metrics like MVRV (Market Value to Realized Value) help assess whether holders are underwater relative to historical cost. Historically, low MVRV levels tend to coincide with major bottoms. (Binance)
🔹 6. Sentiment & Macro Factors
Extreme fear — fund outflows, ETF redemptions, bearish headlines — can coincide with downside exhaustion. Conversely, signs of return inflows often signal the beginning of accumulation. (Reuters)
📆 Bitcoin’s Cycles: Important Perspective
Bitcoin historically exhibits boom-bust cycles (e.g., 2017–2018, 2021–2022). Each cycle includes phases of:
- Acceleration (rapid gains),
- Distribution (profit taking),
- Descent (correction/bear market),
- Accumulation (bottom building),
- Renewal (new bull phase).
Some analysts believe the most recent cycle is in the descent/accumulation phase, where deeper lows and sideways action may extend before a firm bottom forms.
🧩 Where Might the Bottom Be?
No single price level can be guaranteed. However, combining the tools above suggests that the bottom likely occurs:
✔ When RSI and other oscillators show oversold + bullish divergence
✔ AND volume confirms selling pressure exhaustion
✔ AND key moving averages are tested and held
✔ AND on-chain metrics like MVRV reach historically low ranges
As of early Feb 2026, real-time indicators show Bitcoin is in a strong sell/neutral regime, implying weak technical support presently. (Investing.com India)
📈 A Balanced Bottom-Finding Strategy
Here’s a high-level framework traders and investors use:
🧭 Step-by-Step
- Watch RSI & divergence: RSI <30 with rising divergence often hints at decompression rather than continuation.
- Confirm with volume spikes: A capitulation candle with huge volume followed by lower volume sell offs can indicate exhaustion.
- Check multi-timeframe MAs: If price stabilizes above critical MAs with tightening volatility, it looks less bearish.
- On-chain data as confirmation: Low MVRV + high hodler activity may suggest holders are not selling.
- Macro context: Keep an eye on ETF flows, regulation news, and risk appetite in global markets.
🧠 Final Thoughts
Finding a bottom is a combination of art and science. There’s no guaranteed formula, but confluence of multiple signals — structural support levels, momentum oscillators, on-chain behavior, sentiment extremes, and macro dynamics — strongly improves confidence.
Bitcoin’s current environment echoes past deep corrections. Yet history shows that the greatest gains often come after the pain has stopped – not before.
Stay disciplined, use risk management, and blend technical insights with long-term perspective.