
Most Traders Still Ignore This Chart — And That’s Why They Keep Losing Money
In today’s fast-moving financial markets, many traders still rely on traditional indicators like RSI, MACD, or moving averages. But what if the biggest reason traders lose money is because they ignore the most powerful order-flow tool used by professional traders — the Volume Footprint Chart?
Institutional traders, hedge funds, and professional scalpers increasingly use footprint charts to understand the real battle between buyers and sellers. Yet many retail traders still don’t use them.
This guide explains why ignoring the Volume Footprint Chart could be costing traders profits and how it reveals hidden market activity that traditional charts cannot show.
What Is a Volume Footprint Chart?
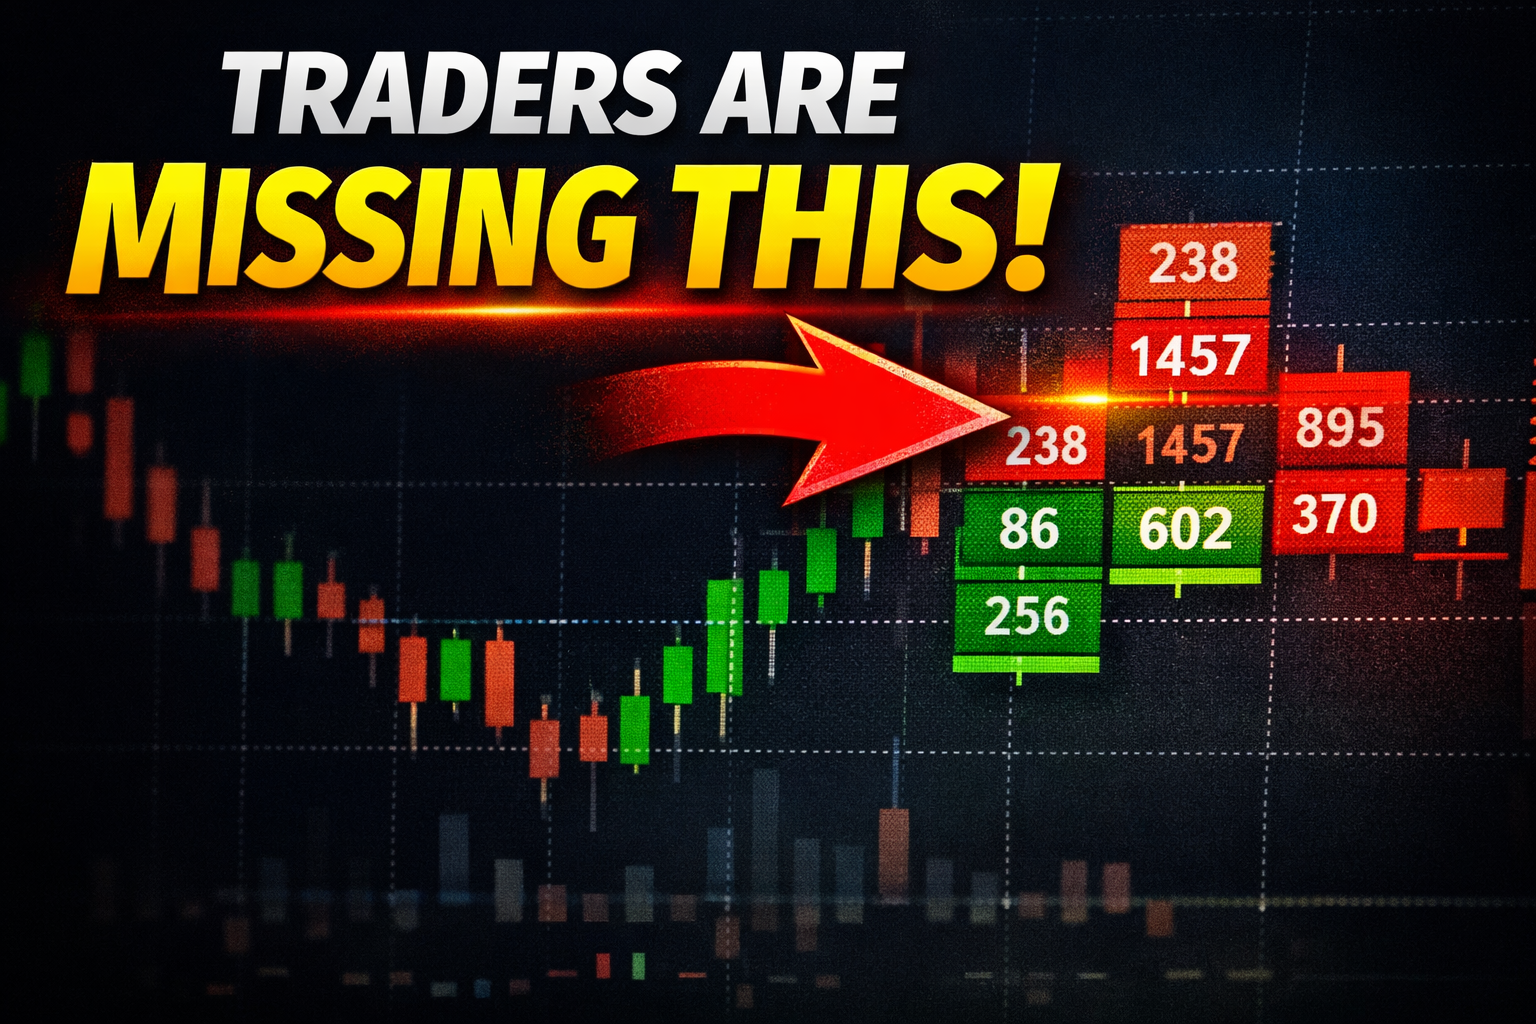
A Volume Footprint Chart is an advanced order-flow trading tool that shows exactly how much buying and selling happened at every price level inside a candle.
Unlike normal candlestick charts, footprint charts display:
- Bid volume
- Ask volume
- Delta (buying vs selling pressure)
- Absorption
- Imbalances
This allows traders to see where smart money enters or exits the market.
Many professional traders believe that order flow analysis using footprint charts is the closest view to real market activity.
Why Most Traders Still Ignore Footprint Charts
Despite its power, many retail traders avoid footprint charts for several reasons:
1. They Look Complicated
At first glance, footprint charts appear overwhelming because they contain numbers inside each candle.
But once understood, they provide far more information than traditional indicators.
2. Most Trading Courses Don’t Teach It
Most trading education focuses on:
- Moving averages
- RSI
- Support & resistance
Very few teach order flow trading or footprint analysis, even though it’s widely used by professionals.
3. Many Traders Depend Only on Indicators
Indicators are lagging tools, while footprint charts reveal real-time buying and selling pressure.
How Footprint Charts Reveal Smart Money Activity
One of the biggest advantages of footprint charts is the ability to detect institutional activity.
Delta Analysis
Delta shows the difference between aggressive buyers and aggressive sellers.
- Positive delta → strong buying pressure
- Negative delta → strong selling pressure
But the real insight comes when price moves opposite to delta.
Example:
- Huge positive delta
- Price fails to move up
This indicates absorption by large sellers.
This is often a hidden signal of a potential market reversal.
The Powerful Footprint Patterns Most Traders Miss
1. Delta Trap (Institutional Trap)
This occurs when:
- Delta shows aggressive buying
- Price suddenly reverses downward
It means smart money trapped buyers.
This is one of the most reliable reversal signals in order-flow trading.
2. Absorption Pattern
Absorption happens when large limit orders absorb aggressive market orders.
Example:
- Massive selling volume appears
- Price refuses to drop
This indicates buyers absorbing the selling pressure.
Often this leads to strong bullish moves.
3. Stacked Imbalances
Stacked imbalance happens when multiple price levels show strong buy or sell imbalances.
Example:
3–5 stacked buy imbalances indicate institutional buying pressure.
This often leads to momentum breakout moves.
How Professional Traders Use Footprint Charts
Many advanced traders combine footprint charts with volume profile and VWAP.
Typical workflow used by professionals:
- Identify key levels using Volume Profile (POC, VAH, VAL)
- Wait for price to reach the level
- Observe footprint chart behavior
- Enter trade when absorption or imbalance appears
This method allows traders to enter trades with confirmation from real order flow.
Best Markets for Footprint Chart Trading
Footprint charts work best in high-liquidity markets, such as:
- Stock index futures
- Cryptocurrency markets
- Forex futures
- Commodities
Popular platforms that support footprint charts include:
- ATAS
- Sierra Chart
- NinjaTrader
- Quantower
Why Footprint Charts Are Becoming Popular in 2026
As markets become more competitive and algorithmic trading increases, traders are looking for tools that reveal deeper market structure.
Footprint charts provide:
- True order flow insight
- Real-time institutional activity
- High-precision entry signals
Because of this, order flow trading and footprint charts are trending topics among professional traders in 2026.
The Biggest Mistake Traders Make
The biggest mistake traders make is relying only on lagging indicators.
Indicators react after price moves.
Footprint charts reveal why price moves.
Understanding the battle between buyers and sellers gives traders a major advantage.
Final Thoughts
The Volume Footprint Chart is one of the most powerful tools in modern trading, yet many traders still ignore it.
Those who learn to read delta, imbalances, and absorption patterns gain a deeper understanding of the market.
In a world dominated by algorithmic trading and institutional money, tools like footprint charts can help traders see the hidden story behind every price move.
Ignoring this tool may be one of the biggest reasons many traders struggle in today’s markets.