
Trading Tools

The ONLY Volume Profile Levels That Actually Matter
If you’re using Volume Profile and still feel confused, you’re not alone. Most traders mark every bump and curve on the profile… then wonder why price ignores all of them. Here’s the uncomfortable truth: Only a few Volume Profile levels actually move the market.Everything else is visual noise. Let’s break down the ONLY Volume Profile […]

Best Price Levels for Long-Term Crypto Investment
A Spiritual + Strategic Guide for BTC, ETH, SOL & Major Coins Long-Term Crypto Investment is not created by chasing hype or buying tops. It is built through patience, discipline, correct price zones, and alignment with market cycles. At spritualtrading.com, we believe crypto investing should combine: This article explains where and how to invest long-term […]
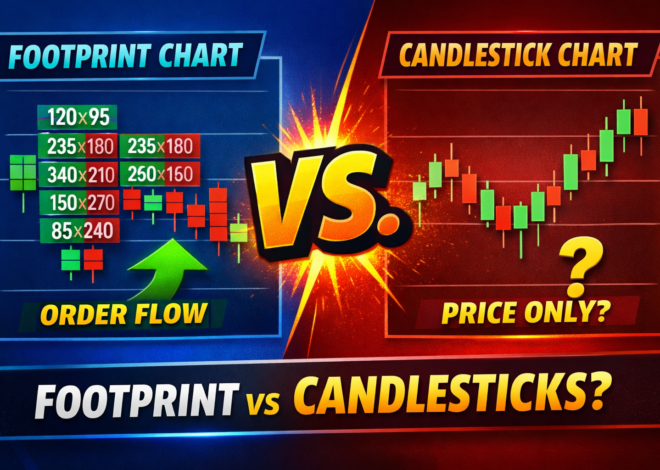
Difference Between Footprint vs Traditional Candlesticks
🟩 1. Introduction Most traders begin with traditional candlestick charts because they show price movement in a simple visual form. However, as traders evolve, they seek more context — especially about who is buying, who is selling, and how aggressively. This is where the Order Flow Footprint chart becomes a major upgrade. 🟦 2. What […]
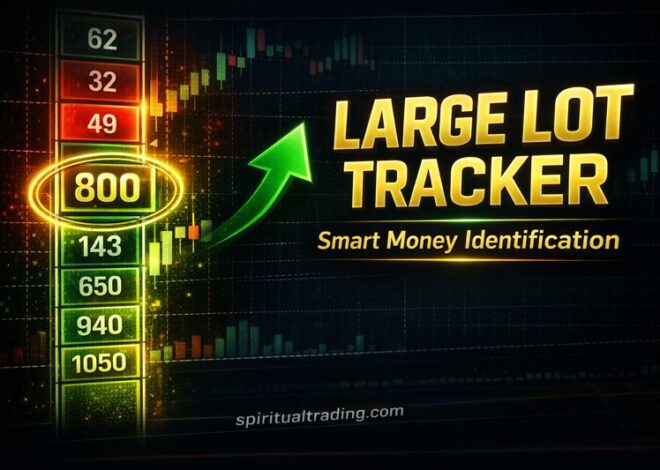
Large Lot Tracker: Smart Money Identification in Footprint
In Orderflow trading, the biggest edge is identifying where smart money enters the market.Price doesn’t move because retail traders buy or sell—price moves when large orders hit the market. A Large Lot Tracker is a critical footprint concept that exposes: This is one of the highest-accuracy smart money detection tools inside the footprint chart. 🎯 […]
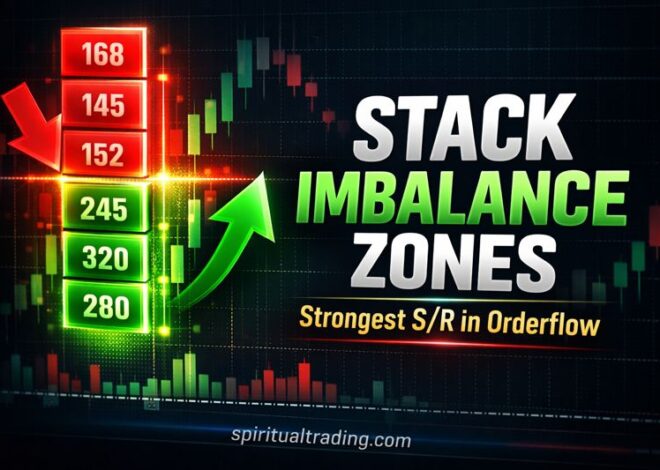
Stack Imbalance Zones – The Strongest Support & Resistance in Orderflow
In Orderflow trading, the most powerful institutional support and resistance levels are not drawn by retail indicators—they are created by Stacked Imbalances.A stacked imbalance shows aggressive, one-sided buying or selling, concentrated across multiple price levels inside a single candle. Whenever this stacking happens, it exposes: These zones often become the turning points of the market, […]
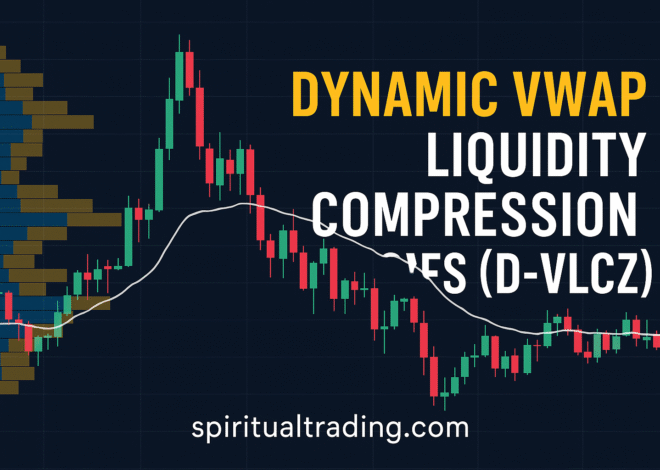
Dynamic VWAP Liquidity Compression Zones (D-VLCZ): The Hidden Engine Behind Explosive Market Moves
Most VWAP trading methods rely on simple mean-reversion or trend confirmation. But modern markets — driven by algo-based liquidity engines — require something more advanced: A way to detect where liquidity is silently compressing around VWAP before a violent expansion move. This is where Dynamic VWAP Liquidity Compression Zones (D-VLCZ) come in. D-VLCZ are zones […]
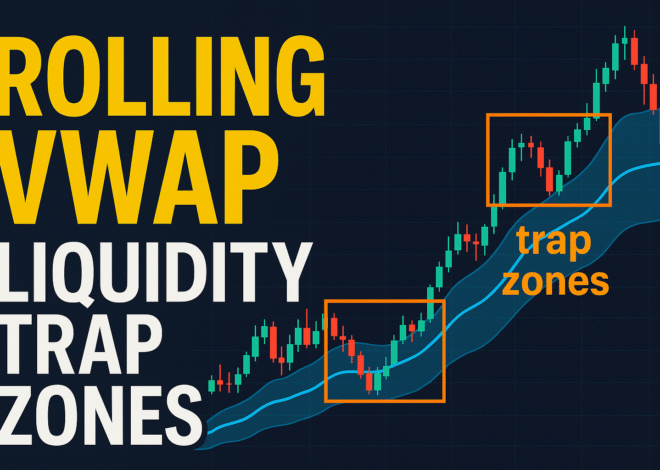
Rolling VWAP Liquidity Trap Zones (RLTZ): The Hidden Institutional Footprint Traders Are Missing
In the modern intraday market—dominated by algorithms, high-frequency trading, and smart money—traditional indicators no longer reveal the real game. Traders who still depend on static VWAP, basic moving averages, or horizontal support–resistance often get trapped exactly where institutions want them. This is where the concept of Rolling VWAP Liquidity Trap Zones (RLTZ) becomes a trading-edge […]
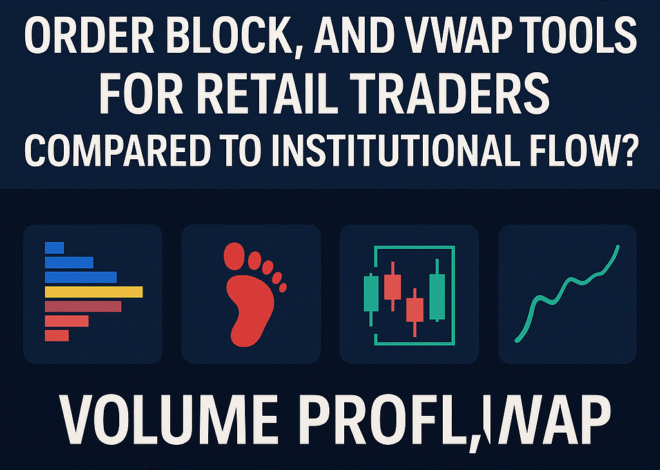
How Reliable Are Volume Profile, Footprint, Order Block, and VWAP Tools for Retail Traders Compared to Institutional Flow?
Every retail trader dreams of seeing what institutions see.Tools like Volume Profile, Footprint charts, Order Blocks, and VWAP promise to reveal where “smart money” is buying or selling. But how much truth is there in that belief? In reality, institutions and retail traders do not operate on the same data layer.What retail sees as “institutional […]