
Dynamic VWAP Liquidity Compression Zones (D-VLCZ): The Hidden Engine Behind Explosive Market Moves
Most VWAP trading methods rely on simple mean-reversion or trend confirmation. But modern markets — driven by algo-based liquidity engines — require something more advanced:
A way to detect where liquidity is silently compressing around VWAP before a violent expansion move.
This is where Dynamic VWAP Liquidity Compression Zones (D-VLCZ) come in.
D-VLCZ are zones where price, VWAP, liquidity flows (CVD), and volume distribution converge tightly, indicating that smart money is:
- building positions,
- absorbing orders,
- trapping impatient traders,
- preparing for a one-directional expansion.
Think of D-VLCZ as a pressure cooker zone around VWAP.
When it breaks → a powerful trend begins.
2. What Exactly Is a D-VLCZ?
A Dynamic VWAP Liquidity Compression Zone is formed when:
- Price oscillates tightly around Rolling VWAP
- CVD shows absorption or hidden divergence
- Volume Profile POC shifts minimally
- Candle ranges shrink → volatility compression
- Repeated liquidity sweeps fail to break structure
In simpler words:
Price + VWAP + Liquidity + Volume are compressing into one invisible box.
Once that box breaks, the market expands sharply.
3. How to Identify a D-VLCZ (Step-by-Step)
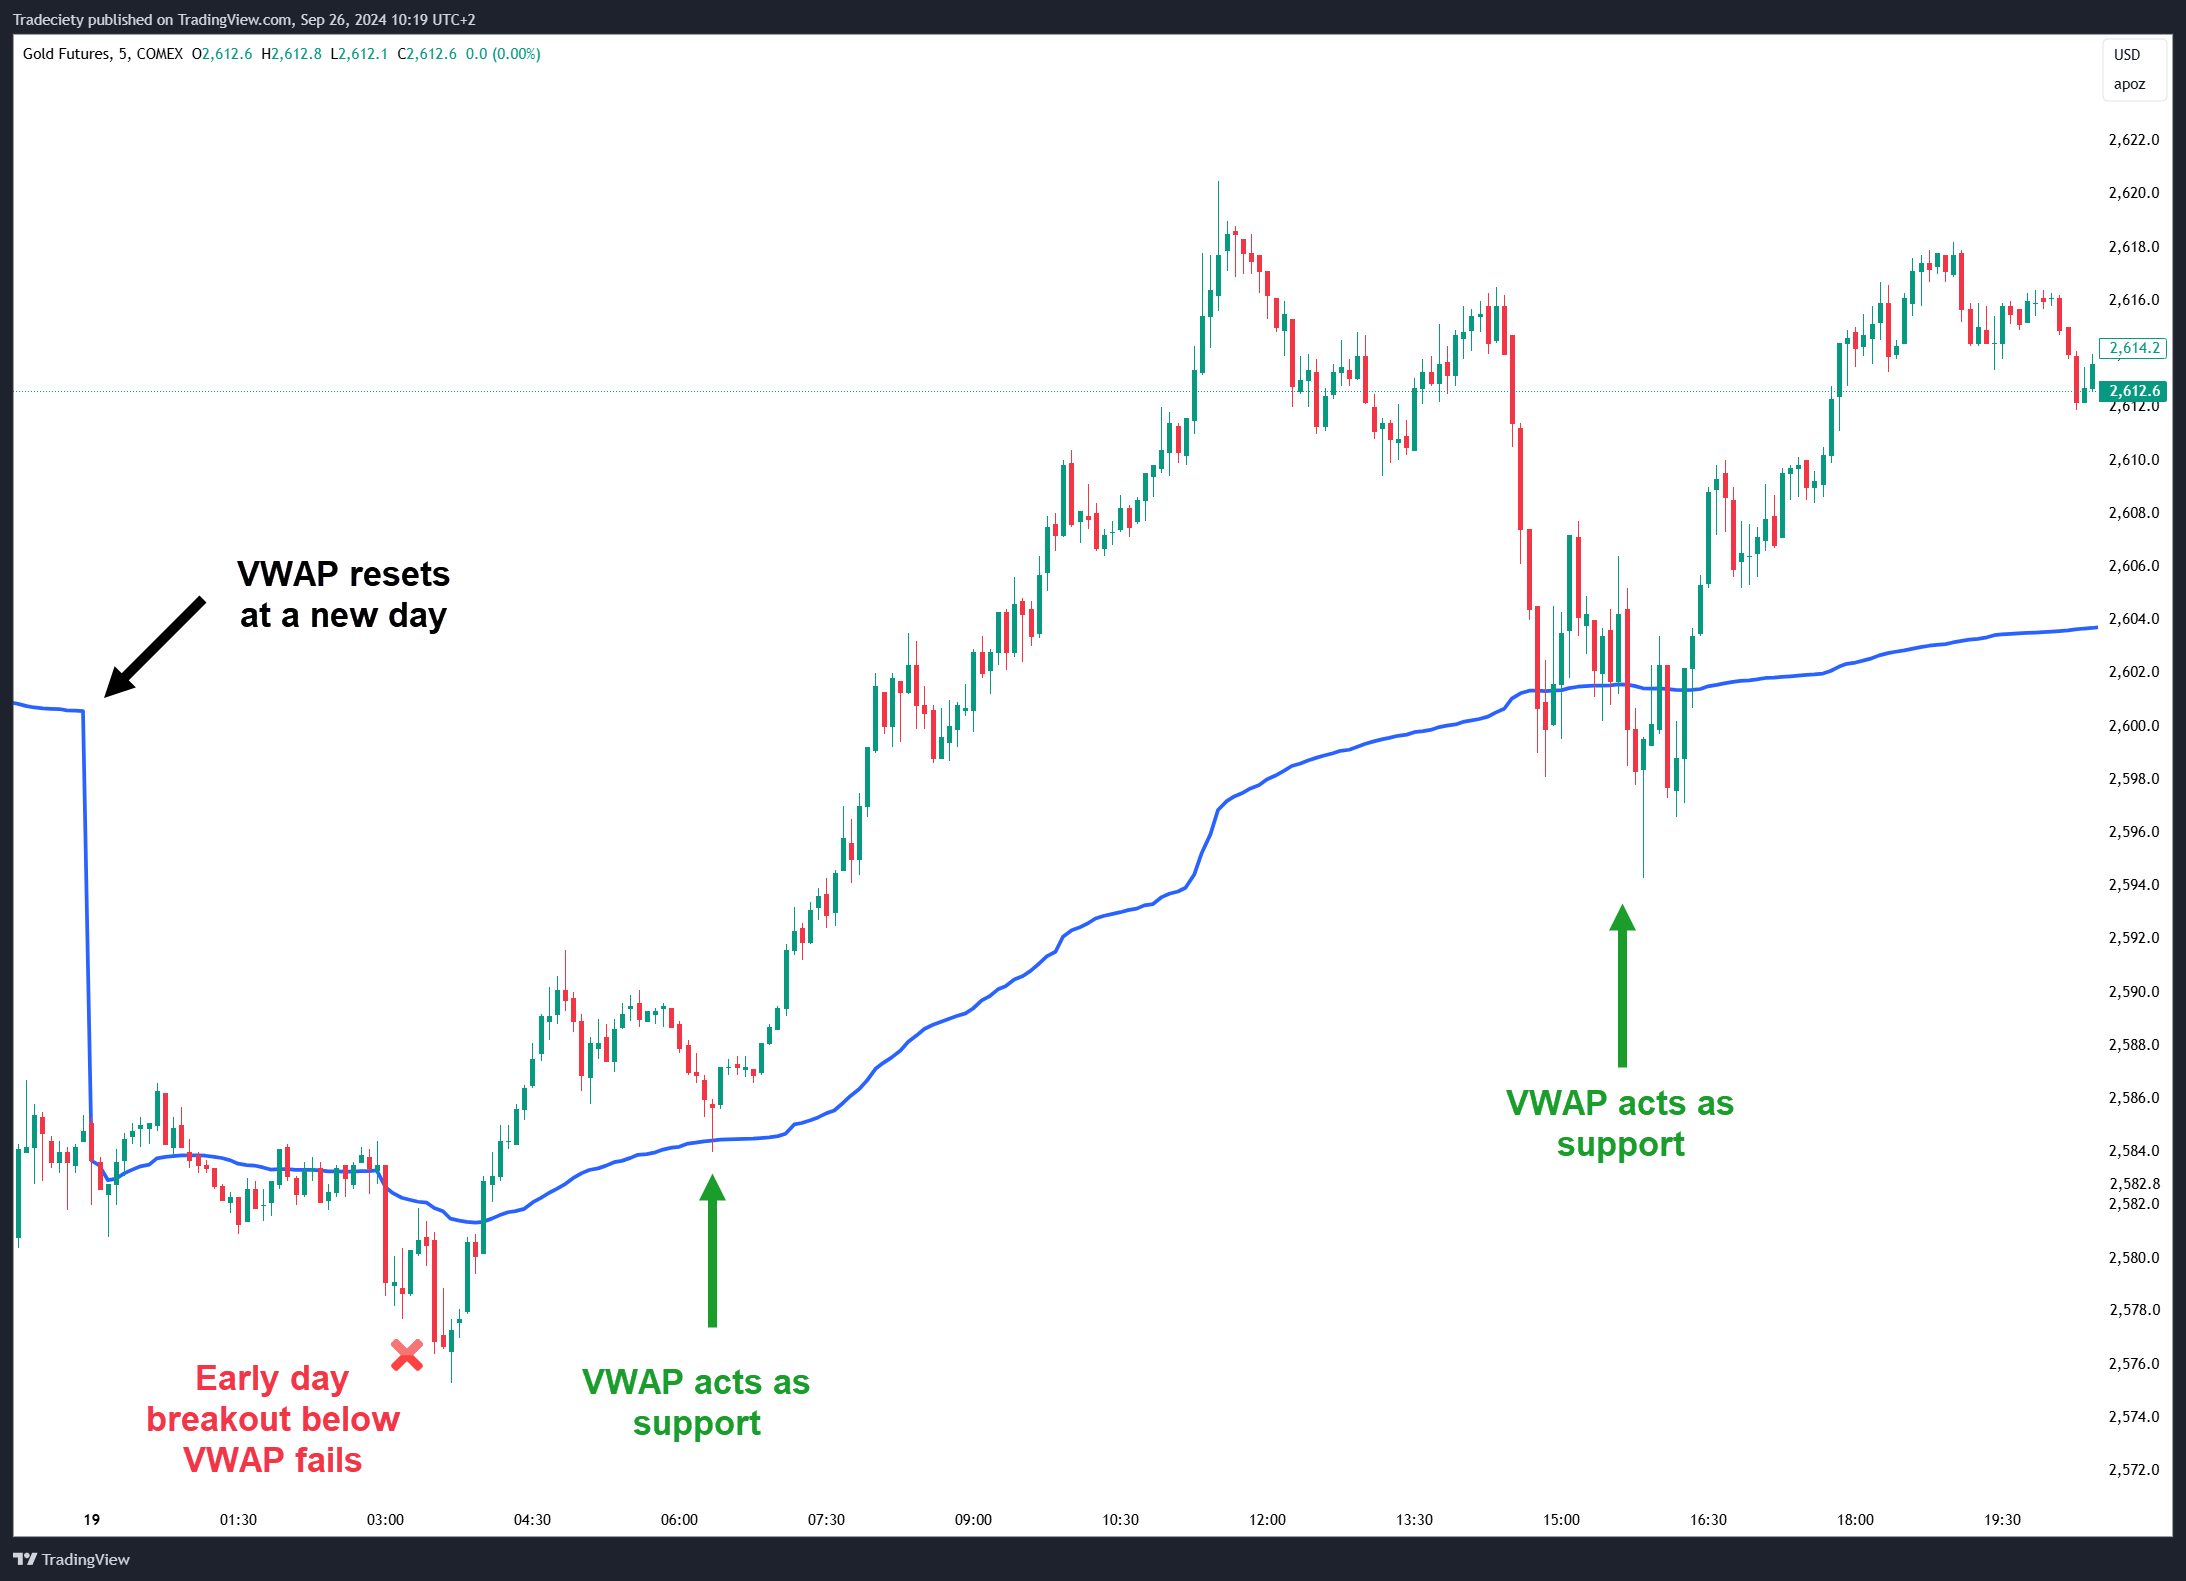
Step 1: Plot Rolling VWAP
Use a rolling VWAP with a short window (15m/30m).
You want VWAP that moves with market micro-structure.
Step 2: Observe Price Compression Around VWAP
Signs of compression:
- multiple small candles,
- wicks absorbing liquidity,
- price failing to break away from VWAP.
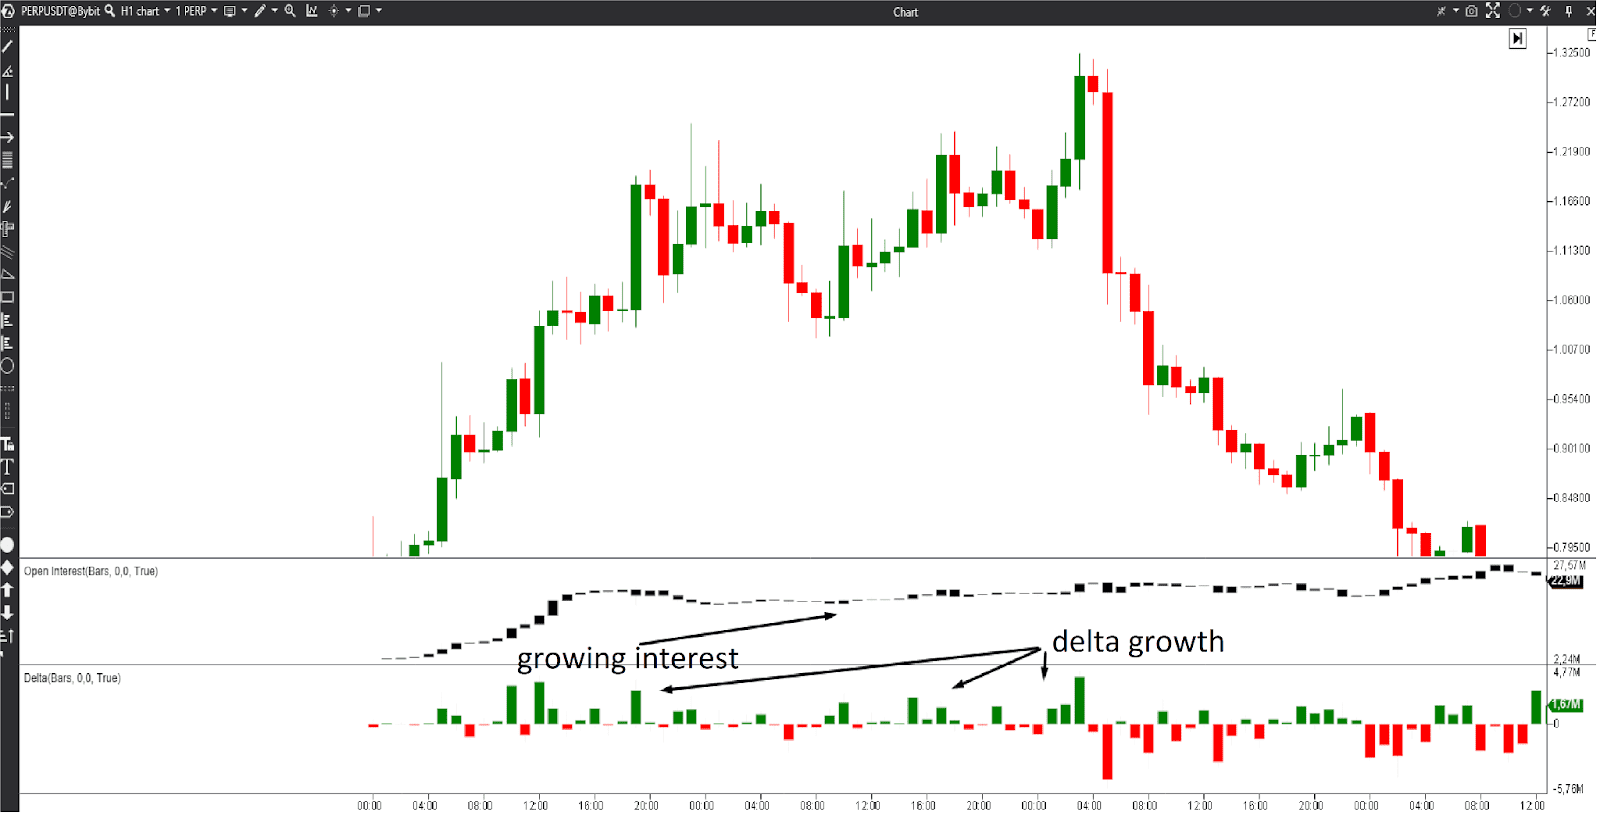
Step 3: Analyze Liquidity Flow (CVD)
CVD should show:
- divergence (price flat but CVD rising/falling),
- flat absorption (CVD flat while price tests VWAP),
- trap signature (CVD rising but price fails to go up).
These are footprints of smart money.
Step 4: Check Micro POC Stability
Plot 5m or 15m candle POCs.
If POC stays inside a 0.15–0.30% band → major clue.
It means:
Market makers are controlling the auction near VWAP.
Step 5: Volatility Compression
Use indicators like:
- ATR decline,
- shrinking candle bodies,
- reduced wick distance.
This means pressure is building.
4. When Does a D-VLCZ Break?
A break happens when one of these triggers fires:
Trigger 1: VWAP Rejection + Large CVD Spike
This shows aggressive entry by smart money.
Trigger 2: POC Shift Out of Compression Zone
POC moving outside the zone = value migration = trend beginning.
Trigger 3: High-Volume Displacement Candle
A big candle breaking the compression shows momentum ignition.
Trigger 4: Failed Liquidity Sweep
Sweep of local highs/lows, followed by:
- strong reversal,
- VWAP reclaim,
- CVD reversal.
This is the cleanest breakout entry.
5. How To Trade D-VLCZ (Your Trading Edge)

There are 3 high-probability trading methods:
Method 1: The VWAP Reclaim Setup (Gold Standard)
Works best for indices, BankNifty, Nifty, Nasdaq, SPX.
Entry:
Price sweeps lows → reclaims VWAP → CVD flips green → POC shifts up.
Stop-loss:
Below compression low.
Target:
2× or next liquidity pool.
Method 2: The Compression Breakout Entry
Price closes strongly outside compression.
Entry trigger:
High-volume displacement candle.
Stop-loss:
Inside compression band.
Target:
Measured move = height of compression × 2 or × 3.
Method 3: The VWAP Liquidity Trap Reversal
Detects reversals created by algos.
Signals:
- CVD trending opposite to price.
- Price rejects VWAP after sweeping.
- POC flips.
This trap often causes a massive reversal.
6. Why D-VLCZ Works (The Algo Logic Behind It)
Markets today are dominated by:
- high-frequency traders,
- market makers,
- execution algorithms.
These players prefer:
building large positions inside liquidity compression zones.
Why?
Because compression zones:
- offer low volatility,
- allow silent order absorption,
- trap retail traders,
- create clean breakout opportunities.
D-VLCZ reveals_algo footprints that normal VWAP traders never see.
7. D-VLCZ Compared to Standard VWAP
| Feature | Standard VWAP | Dynamic VWAP Liquidity Compression Zones |
|---|---|---|
| Measures mean price | ✔️ | ✔️ |
| Shows trend | ✔️ | ✔️ |
| Detects liquidity traps | ❌ | ✔️ |
| Identifies smart money positions | ❌ | ✔️ |
| Predicts breakout zones before they happen | ❌ | ✔️ |
| Combines VWAP + CVD + POC + Compression | ❌ | ✔️ |
D-VLCZ is next-level VWAP trading.
8. Best Timeframes for D-VLCZ
✔ 5m + 15m (micro structure)
✔ 15m + 30m (positional intraday)
✔ 30m + 1h (index, FX, crypto)
Ideal combo for you (based on your strategy memory):
30m VWAP + 15m POC + 5m execution + CVD confirmation.
9. Advanced Add-Ons (Optional But Powerful)
1. Nadaraya-Watson Bands
Use NW bands around VWAP to detect extreme liquidity pockets.
2. Rolling VWAP Bands
Add two dynamic standard deviation bands.
3. Order Block Filter
If compression sits inside an OB → breakout is explosive.
10. Conclusion
Dynamic VWAP Liquidity Compression Zones (D-VLCZ) are a breakthrough technique that combines:
- VWAP
- Micro POC
- Liquidity flow (CVD)
- Volatility compression
- Liquidity traps
This model shows WHERE smart money is preparing for a massive move — before the breakout happens.
If you master D-VLCZ, trading becomes predictable:
- Breakouts stop surprising you
- Reversals make sense
- Fakeouts become opportunities
- Your confidence increases
- Overtrading decreases