Difference Between Footprint vs Traditional Candlesticks
🟩 1. Introduction
Most traders begin with traditional candlestick charts because they show price movement in a simple visual form. However, as traders evolve, they seek more context — especially about who is buying, who is selling, and how aggressively.
This is where the Order Flow Footprint chart becomes a major upgrade.
🟦 2. What Traditional Candlesticks Show
Traditional candles show only four price points:
- Open
- High
- Low
- Close
Plus color for bullish/bearish sentiment.
They tell you what price did, but not how and why price moved.
Limitations of Candlesticks
Candles do not show:
❌ who initiated the move (buyers or sellers)
❌ how much volume traded at each price
❌ whether breakout is real or fake
❌ whether buyers are trapped or sellers are trapped
❌ if institutions absorbed or initiated orders
This lack of internal data is why most breakouts fail and beginners get trapped.
🟥 3. What Footprint Charts Show
Footprint charts display actual order flow at every price level, showing:
✔ Volume traded
✔ Bid x Ask distribution
✔ Delta (net buying vs selling)
✔ Imbalance (aggressive buyer/seller dominance)
✔ Absorption (big passive orders stopping price)
✔ Trapped traders
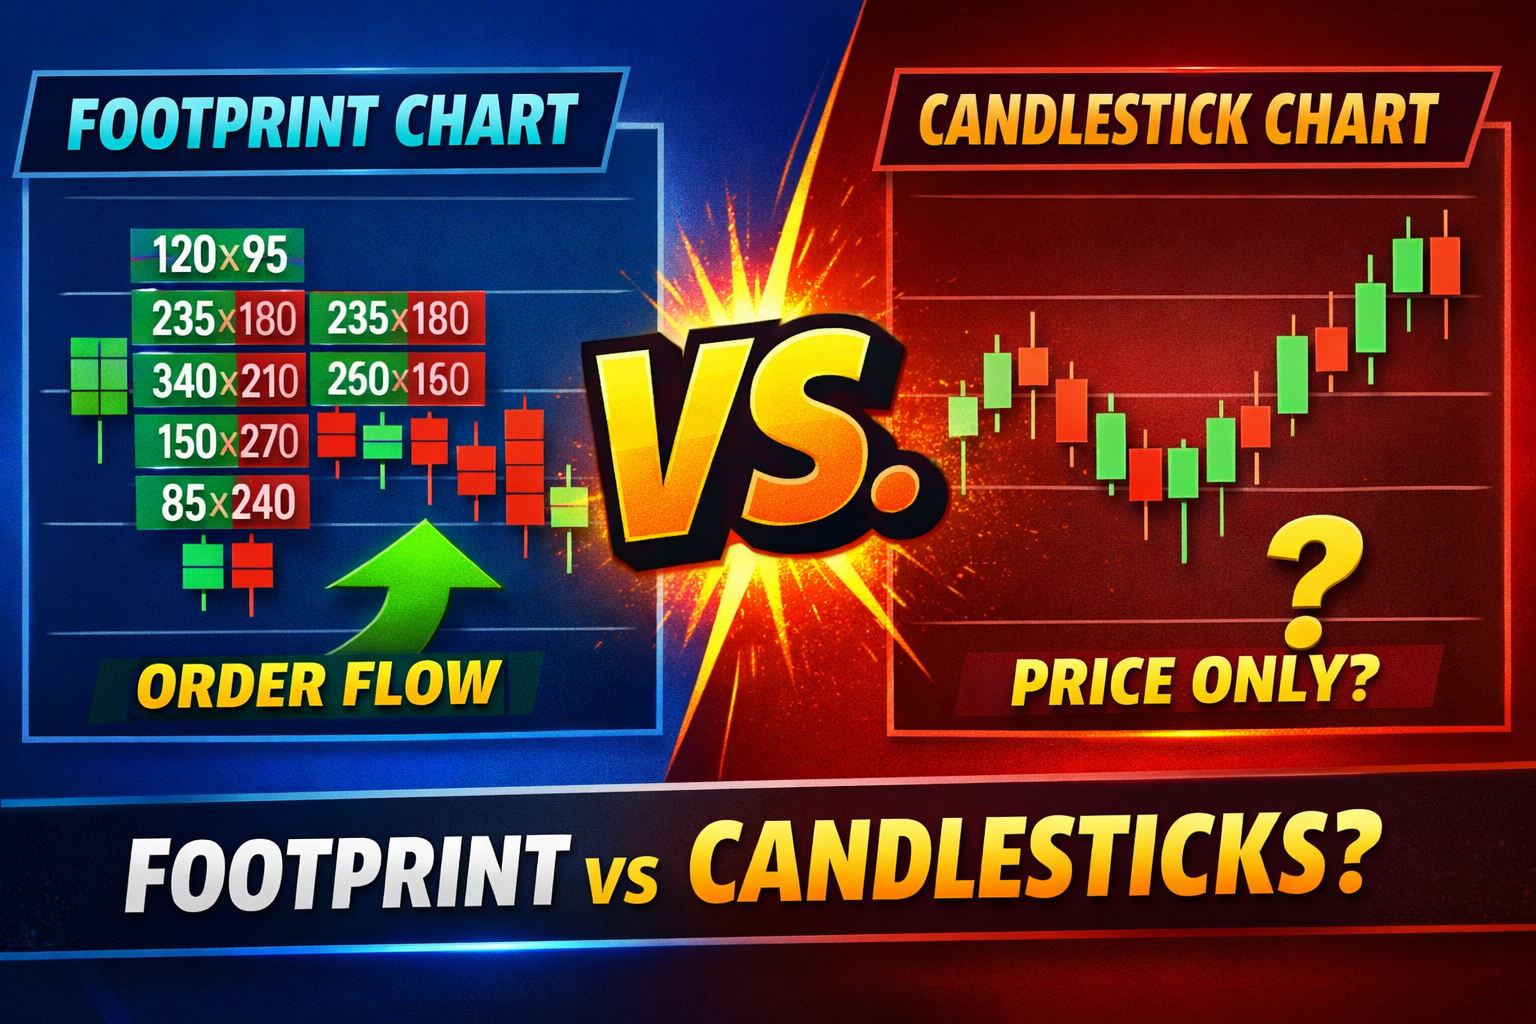
A typical footprint candle may show something like:
   120x95
   235x180
   340x210
   150x270
This means at each price level, how many contracts were executed:
Bid x Ask = Sellers (Aggressive) vs Buyers (Aggressive)
🟨 4. The Key Difference: Context vs. No Context
| Feature | Candlesticks | Footprint |
|---|---|---|
| Price O/H/L/C | Yes | Yes |
| Volume Total | Only total | Shows volume per tick |
| Bid x Ask | No | Yes |
| Delta | No | Yes |
| Imbalance | No | Yes |
| Absorption | No | Yes |
| Trapped traders | No | Yes |
| Bull/Bear Strength | Guessing | Measurable |
| Institutional Activity | Invisible | Detectable |
| Execution Signals | Weak | Strong |
| Breakout Confirmation | Poor | Reliable |
In short:
Candles show price movement. Footprint shows the reason behind the movement.
🟧 5. Footprint Helps With Professional Questions
Pro traders care about:
✔ Who initiated the move
✔ Are buyers aggressive or passive?
✔ Is volume supporting breakout?
✔ Are institutions absorbing to reverse price?
✔ Are traders being trapped?
Candlesticks cannot answer these questions — footprint can.
🟪 6. Example: Breakout Scenario
Scenario: Price breaks resistance
- Candlestick view:
Price looks bullish → traders go long. - Footprint view:
Breakout shows: - weak delta
- no bid-ask imbalance
- high absorption at top
- sellers stepping in
Such breakouts usually fail → traders get trapped.
🟫 7. Example: Liquidity Sweep
On candlesticks:
- looks like a wick
On footprint:
- shows aggressive sellers got absorbed by big passive buyers
- reversal likely
This is the kind of microstructure edge pros use.
🟩 8. Use Cases — Who Should Use What
Candlestick is enough for:
✔ Beginners
✔ Swing traders
✔ Higher timeframes
✔ Visual pattern traders
Footprint is required for:
✔ Scalpers
✔ Day traders
✔ Futures traders
✔ Crypto orderflow
✔ Auction market theory
✔ Liquidity traders
✔ Smart money style traders
🟦 9. Why Footprint Improves Accuracy
Footprint increases accuracy because it shows effort vs. result.
- If price moves up with strong delta → trend valid
- If price moves up with negative delta → divergence → reversal likely
This helps to:
✔ avoid traps
✔ reduce false breakouts
✔ identify imbalance
✔ confirm entries
✔ time exits
🟥 10. Backtesting Reality
Candlestick indicators often lag.
Footprint signals are:
✔ real-time
✔ volume-driven
✔ non-lagging
✔ auction-based
Hence edge is execution speed + context, not prediction.
🟨 11. In One Line Summary
Candles tell you WHERE price moved.
Footprint tells you WHY price moved.
🏁 12. Conclusion
Traditional candlesticks are price-based, simple, and useful for beginners. Footprint charts are microstructure-based and useful for professionals seeking precision and true orderflow understanding.
If your trading requires:
- timing entries
- confirming breakouts
- reading institutional behavior
- detecting traps or absorption
then footprint becomes a powerful mandatory tool.