
Spotting Absorption at Point of Control (POC)
1. Introduction
In auction-based trading, the Point of Control (POC) represents the price level where the highest volume traded during a defined session or range. Because large traders prefer operating at value-heavy zones, the POC often becomes a battlefield between buyers and sellers.
When absorption occurs at POC, it signals that passive liquidity is overpowering aggressive orderflow, and the market may be preparing for a reversal or continuation depending on context.
2. What is Absorption? (Quick Definition)
Absorption occurs when:
Aggressive buyers or sellers are “absorbed” by passive limit orders without meaningful price movement.
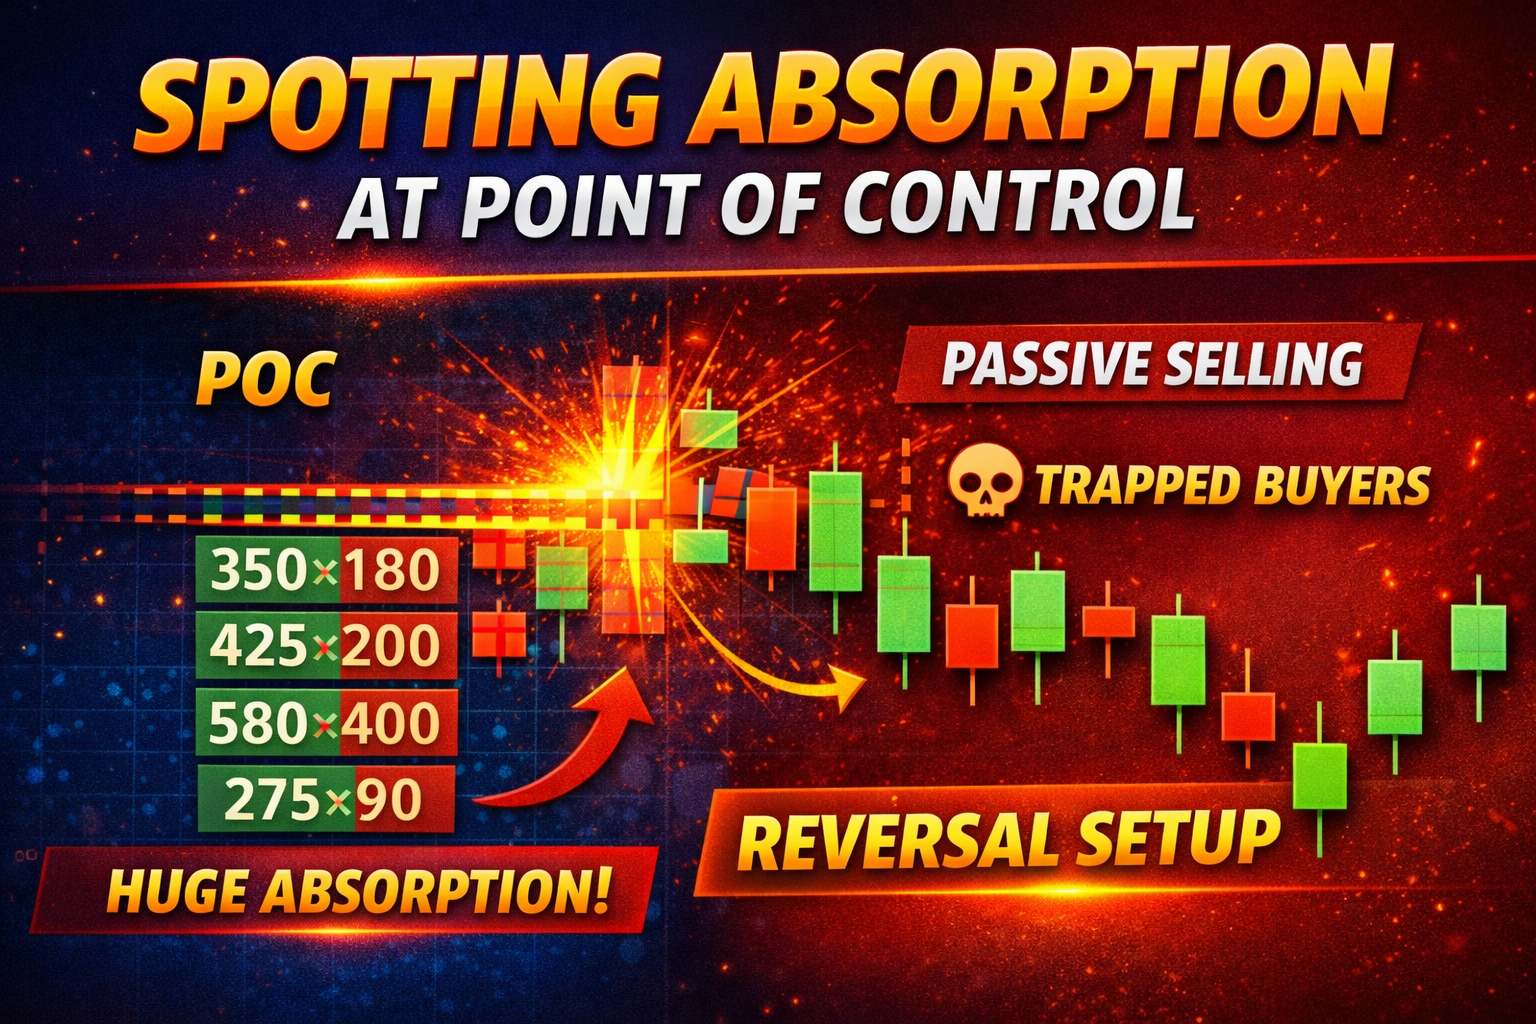
Example:
- Aggressive buyers hit the ask with size
- Price does not move higher
- Passive sellers absorb the volume
- Buyers become trapped → reversal likely
Absorption shows intent of smart money.
3. Why POC Matters for Absorption
POC is not just a volume node — it is a value agreement zone where:
✔ Institutions transact
✔ Rebalancing happens
✔ Inventory transfers occur
✔ Hedgers operate
When absorption shows up here, it tells us:
Someone is defending value at a critical level.
This makes the signal much stronger than absorption at random price points.
4. How Absorption Looks on Footprint Charts
Absorption typically shows as:
A. Large Bid/Ask volume stacking
But no price continuation.
Example footprint:
480x120
520x140
600x150
650x160
700x170
Huge buy imbalance but no price extension → buy absorption.
B. Large stacked delta with failure to follow through
If delta is rising but price isn’t → bullish effort failing.
C. Trapped aggressor behavior
Market pushes into POC but:
- fails to break through
- rotates back out
5. Context Checklist: When Absorption at POC Means Something
Absorption at POC becomes actionable when 4 conditions align:
- Price reaches POC
- Aggressive orders hit
- Passive liquidity absorbs
- Failed follow-through (no range expansion)
If these 4 align, expect rotation away from POC.
6. Two Scenarios: Bullish vs. Bearish Absorption
A. Bullish Absorption at POC (Buyers absorbing sellers)
Trigger signs:
- Sellers hammering bid
- Delta negative
- Price not dropping
- POC holds
- Rotation up
Implication: Continuation upward or breakout.
B. Bearish Absorption at POC (Sellers absorbing buyers)
Trigger signs:
- Buyers lifting ask
- Delta positive
- Price not advancing
- POC capped
- Rotation down
Implication: Reversal or rejection
7. Confluence Factors That Strengthen the Signal
POC absorption is stronger when it aligns with:
✔ VWAP
✔ Value Area High (VAH) / Value Area Low (VAL)
✔ Daily/Weekly POC
✔ Liquidity pools
✔ Order blocks
✔ Session open/close levels
✔ Big round numbers (example: 50/100/1000 levels)
8. Practical Playbook for Traders
Here’s a simple 3-step execution model:
Step 1 — Identify Absorption
Look for:
- high volume
- high delta
- no follow-through
Step 2 — Wait for Rotation Away
Let price prove the rotation; don’t try to predict.
Step 3 — Enter on Retest
Low-risk entry if price comes back to test POC with reduced aggression.
9. Stop-Loss & Target Logic
SL placement
Below/above absorption wick or just beyond POC depending on direction.
Targeting
POC absorption typically rotates back to:
✔ VAH/VAL
✔ Opposite distribution zone
✔ Opposite liquidity pool
10. Common Mistakes
❌ Entering before absorption is confirmed
❌ Ignoring higher timeframe POC alignment
❌ Assuming every POC is defended (it is not)
❌ Trading POC without reading delta
❌ Not waiting for rotation
11. Why This Works
Because absorption is a form of:
Inventory transfer between weak hands and strong hands.
The market often rotates after inventory transfer completes.
12. Simple Summary
Absorption at POC = Smart money defending value + trapping aggressors + setting up rotation.
It is one of the most reliable microstructure signals for:
✔ futures traders
✔ crypto scalpers
✔ liquidity traders
✔ volume profile traders